In this issue:
Screening for Sleep-Related Breathing Disorders
Author

Since I began lecturing to fellow dentists on the importance of screening for sleep-related breathing disorders (SRBD) before placing any type of appliance, I have received many questions about incorporating sleep dentistry into the dental practice. For me, it is critical to have a proper tool to screen patients to determine whether they should be referred to a physician for diagnosis of a sleep airway issue. I always ask dentists who place splints and nightguards without screening the airway, “How do you know you are not causing an obstruction in the airway?”
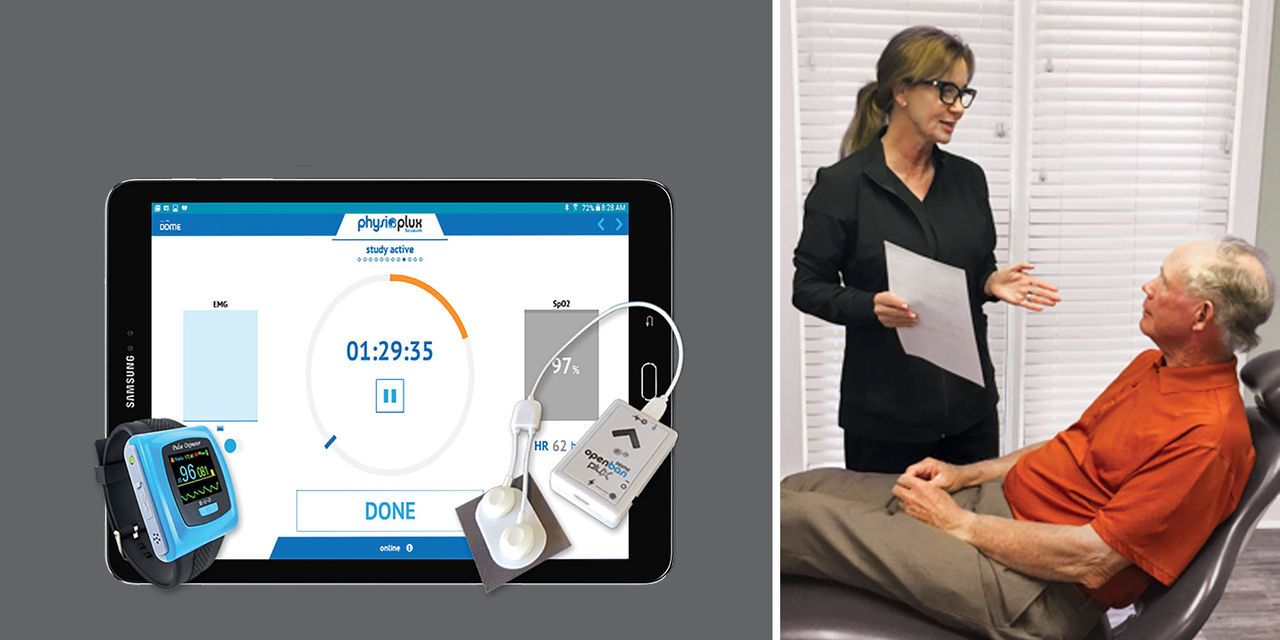
With the release of the GEMPro Wellness Monitor (Glidewell Direct; Irvine, Calif.), my work advocating for sleep dentistry has become much easier, as has screening for sleep-related disorders and the need for follow-up appointments and titrating appliances. Thanks to the wealth of information that this tool makes available, clinicians can more accurately determine which patients require referral to sleep physicians or primary care physicians before placing any type of appliance. The GEMPro Wellness Monitor is a collection of purpose-built devices with sensors to record oxygen saturation, heart rate, masseter activity, snore sounds and body position. All of these readings come together to form a complete picture of patients’ well-being during sleep and deliver unparalleled insights that make screening in the practice more precise than before.
The GEMPro Wellness Monitor is a collection of purpose-built devices with sensors to record oxygen saturation, heart rate, masseter activity, snore sounds and body position.
I will use the following report, of a patient later diagnosed by a physician with obstructive sleep apnea (OSA) and snoring, to explain the ease with which the data gathered from the GEMPro Wellness Monitor can be used to make informed treatment decisions.
CASE STUDY
The first graph on every report is the SpO2 Analysis (Fig. 1). Here, through the GEMPro Wellness Monitor’s pulse oximeter, we are able to see the patient’s oxygen saturation for the duration of his or her sleep. On the right-hand side, we see the patient’s maximum and minimum SpO2 readings. The maximum reading of 99 percent is expected, but the minimum reading of 77 percent is troubling and is in the range often associated with airway issues. Below the graph, we’re shown, from right to left, the amount of time by percentage that the patient’s oxygen saturation levels were below 92 percent, below 89 percent and below 85 percent, respectively. According to the American Thoracic Society, having oxygen saturation levels lower than 89 percent can have a detrimental effect on the body.1 With that said, any percentage other than zero in the center and leftmost boxes is cause for concern, cause for referral of the patient to a physician for follow-up, and cause for titration of any existing appliances as needed.
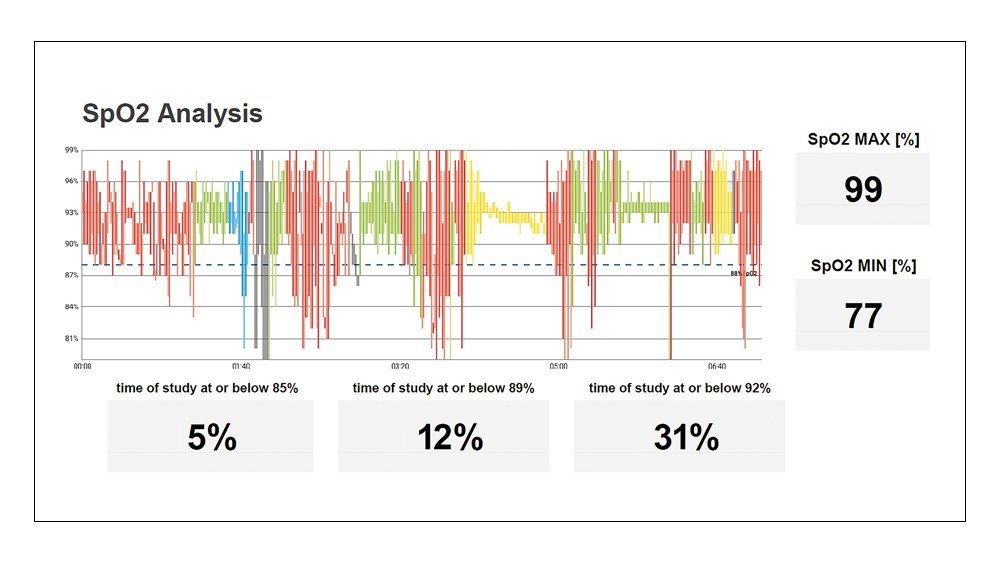
Figure 1: The SpO2 Analysis graph uses data from the pulse oximeter to plot the patient’s oxygen saturation for the duration of sleep.
The next graph is the Heart Rate Analysis (Fig. 2). Once again, we see the patient’s maximum and minimum readings on the right-hand side, as well as boxes below the graph that show the amount of time the patient spent with a heart rate outside of the normal range. For this patient, the graph did not reveal any information that we would consider to be concerning. We do, however, get the opportunity to cross-reference graphs to better understand the relationship between all these data sets. For instance, if this patient were experiencing abnormal increases or decreases in heart rate, we could then see how it affects — or is affected by — SpO2 levels, parafunctional activity and snoring.
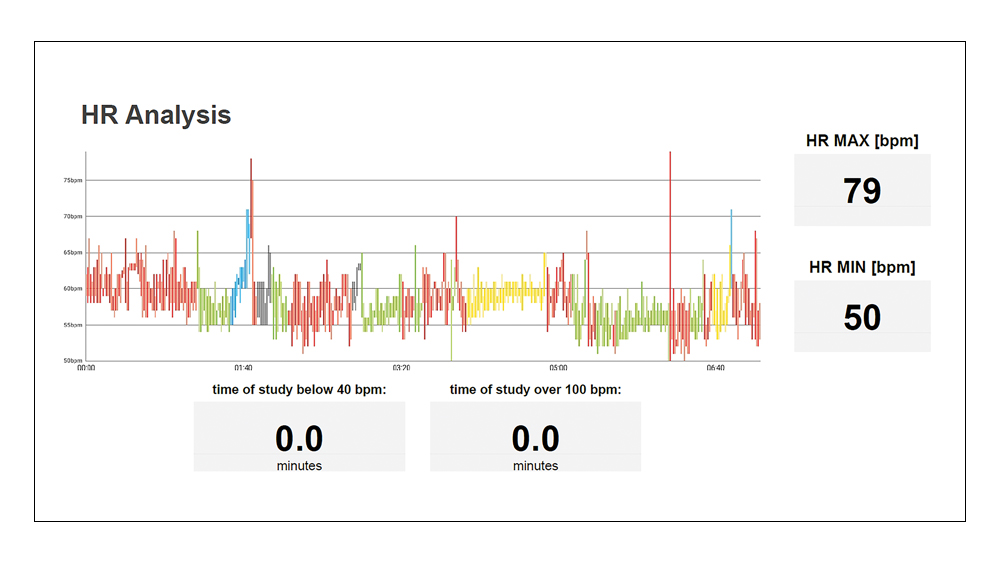
Figure 2: The Heart Rate Analysis graph also uses the pulse oximeter to record the patient’s heart rate, including how long the patient’s heart rate was outside of the normal range.
The Bruxism Analysis graph allows us to see not only if the patient is clenching or grinding, but also the number of events and the amount of force measured per event, as compared to the baseline measurement (Fig. 3). Prior to the screening, as part of the calibration steps, patients are asked to clench their masseters a few times to assess the force they can produce while awake, as shown in the Bio Cal Analysis graph (Fig. 4). This patient’s maximum force while awake was measured at 77 microvolts, and the maximum force during sleep was measured at 47 microvolts. The maximum force while asleep is divided by the maximum force while awake to find the Max Bio Cal Ratio. Patients with severe nighttime bruxism will have a ratio well above 1.0, while patients with minimal nighttime bruxism, much like this patient, will have a ratio below 1.0, as shown in the lower right. Across the bottom of the graph are boxes noting the number of clenching events the patient had, which are categorized by the amount of force measured compared to the patient’s waking force measurement. From right to left, the five boxes show 100, 75, 50, 25 and 10 percent of the patient’s maximum force. Patients with severe clenching will have events with higher force readings, while patients with nighttime grinding habits will have a higher number of events with lower force readings.
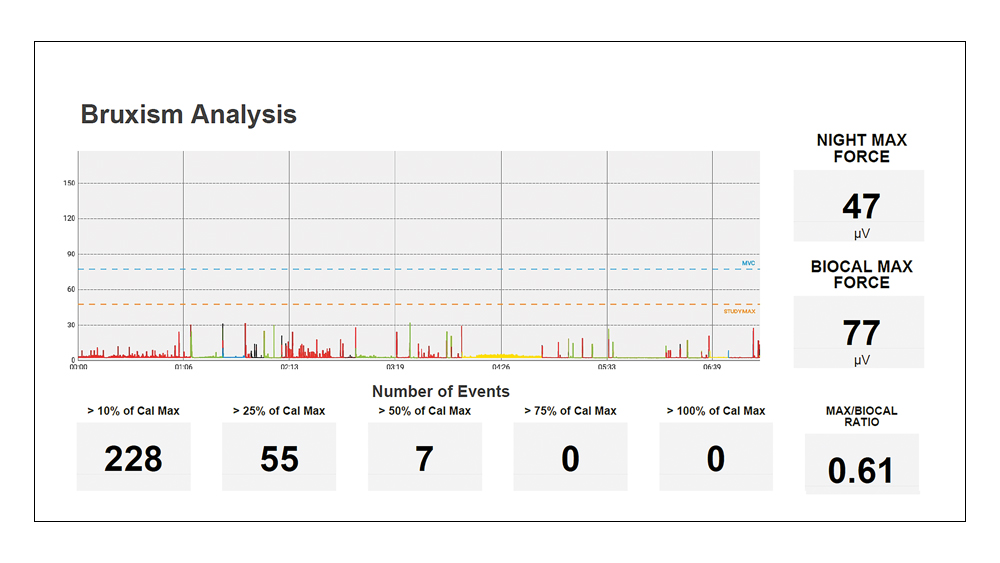
Figure 3: Electrodes from the BioBrux Amplifier are affixed to one of the patient’s masseters, and their total number of jaw movements and the force exerted for each is measured and plotted on the Bruxism Analysis graph.
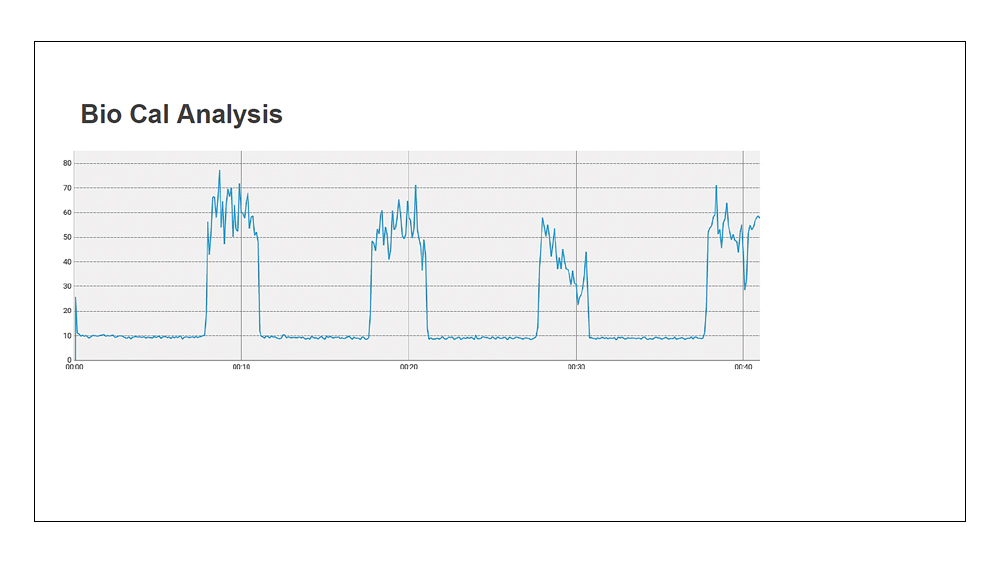
Figure 4: The Bio Cal Analysis graph shows the patient’s bite force measurements taken during the calibration step prior to starting the screening.
In the Audio Signal graph, we see the patient’s audio readings during sleep (Fig. 5). The GEMPro Wellness Monitor’s BioBrux Amplifier measures the intensity and frequency of snoring sounds and plots them on the graph as they occur. It is clear this patient suffers from snoring, as the readings are well above the ambient noise benchmark that was established prior to the screening and are off the charts in many instances. We’re also given the number of minutes the patient’s snore sounds went beyond the set snore threshold, which was a total of 56.3 minutes, as well as the percentage of time spent snoring, which came in at 34 percent.
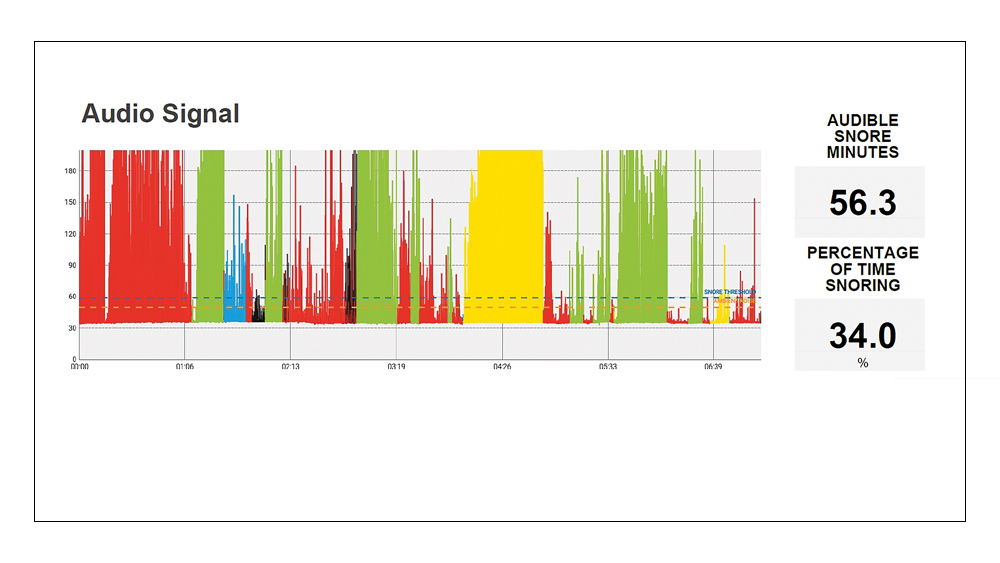
Figure 5: The Audio Signal graph shows the patient’s noise levels — adjusted for ambient noises — measured with the GEMPro Wellness Monitor’s BioBrux Amplifier.
The last report from the patient’s screening is the Position Analysis graph (Fig. 6). Here, the patient’s body position and time spent in each position is recorded and color-coded. The same color-coding is also featured in the SpO2, Heart Rate, Bruxism and Audio reports, and can provide more information for dentists or physicians to use in their recommendations. For instance, we know that this patient does not often sleep on the right side and instead favors sleeping in the supine position and on the left side. We can also see that, despite snoring the loudest while sleeping in the prone position, the patient bruxes much less — if at all — compared to other positions. This information is useful in some cases where a patient may brux, experience lower oxygen saturation, or have an irregular heart rate in one specific sleeping position.
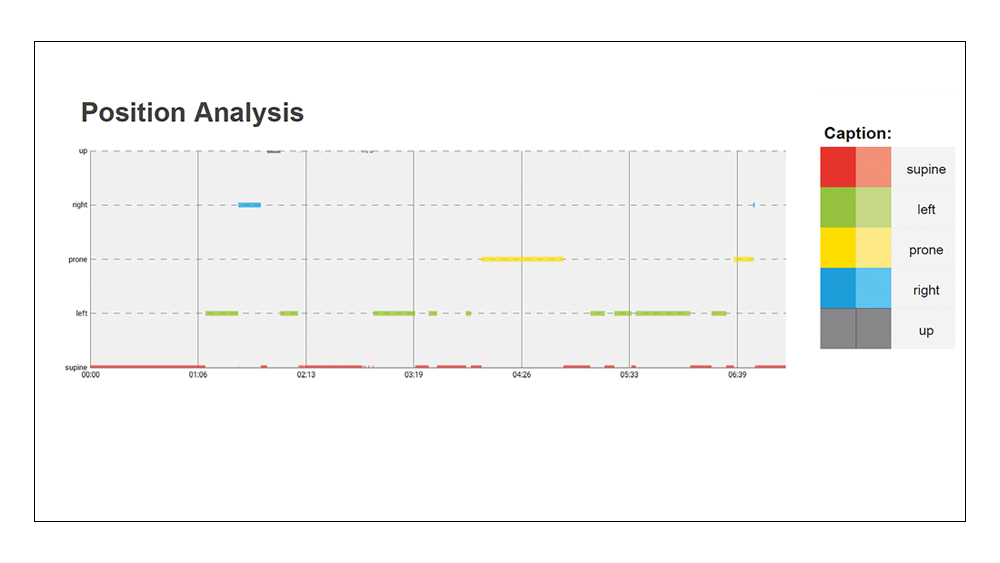
Figure 6: The BioBrux Amplifier also has sensors to detect the patient’s body position and the time spent in each, which is used to create the Position Analysis graph.
CONCLUSION
The tools we use and the data they provide make a world of difference in helping our patients. How can we be certain that an appliance delivered for bruxism is not harmful to the patient’s overall health? By conducting a preliminary screening test, you will be able to make the proper physician referral for patients at risk from OSA. To meet the health needs of our patients, it is incumbent upon us as health care professionals to do everything permitted by our respective state boards of dentistry to improve our ability to screen for and treat sleep-related breathing disorders.
By conducting a preliminary screening test, you will be able to make the proper physician referral for patients at risk from OSA.
Available CE Course
References
- ^Fahy B, Lareau S, Sockrider M. Pulse oximetry. Am J Respir Crit Care Med [internet]. 2011 [cited 2018 Jan 4];184:1. Available from: https://www.thoracic.org/patients/patient-resources/resources/pulse-oximetry.pdf.